
Data Query
Give your users a reporting layer that grows without you. Administrators define a query once — its data source, its parameters and its result columns — and Data Query generates the parameter form, the results grid, the charts and the drill-down navigation automatically. Query SQL, JPA entities or external REST APIs, chain queries through temporary tables, compose dashboards, and design pixel-accurate PDF reports in a visual band editor. Every new report ships at runtime, without a build or a deployment.
View PricingA complete runtime reporting platform, driven entirely by query definitions.
Query Definitions Without Code
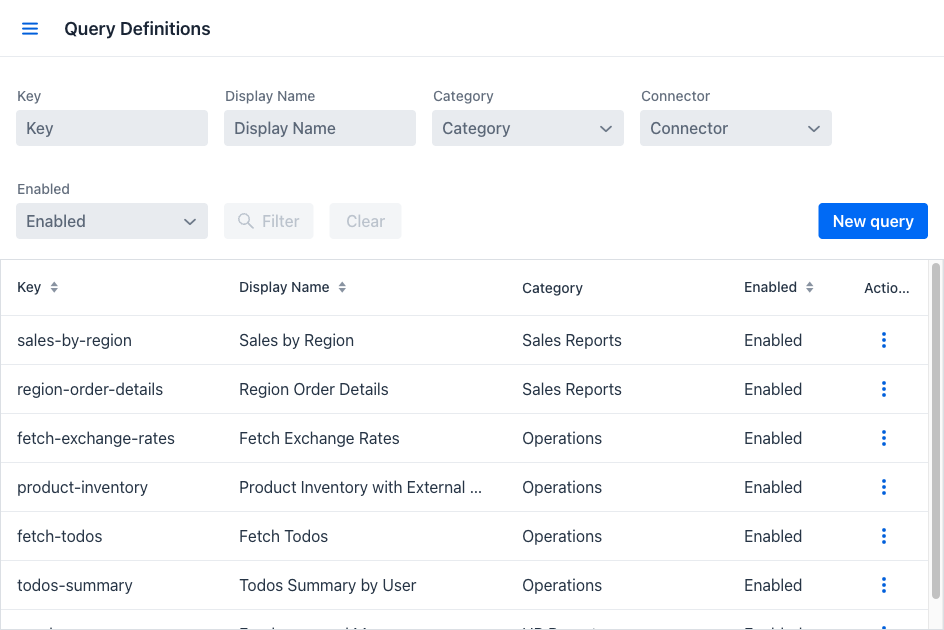
A query definition bundles a data source connector, the query text, its parameters and its result columns. From that single definition the module builds the whole reporting screen — no Java class to write, no application restart to publish it.
Three Data Connectors
Query your application database directly over JDBC (SQL), go through the persistence layer against your JPA entities with code completion (HQL), or call an external service and map its JSON response to rows (REST API).
Type-Aware Parameters
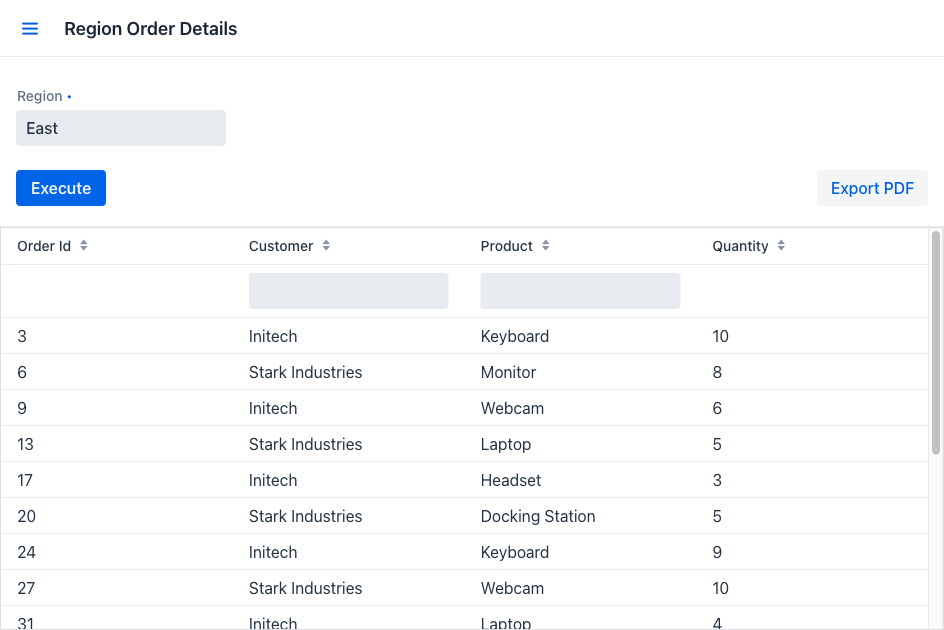
Each parameter declares its type and renders the matching control automatically — date pickers, combo boxes, multi-select fields. Defaults can be fixed values or dynamic generators based on the current date, the current user, or the result of another query.
Query Chaining
Declare dependent queries that run in order and write their results into temporary tables the next query reads from. Parameters flow through the whole chain, letting you express multi-step analysis that a single statement cannot.
Charts & Visualization
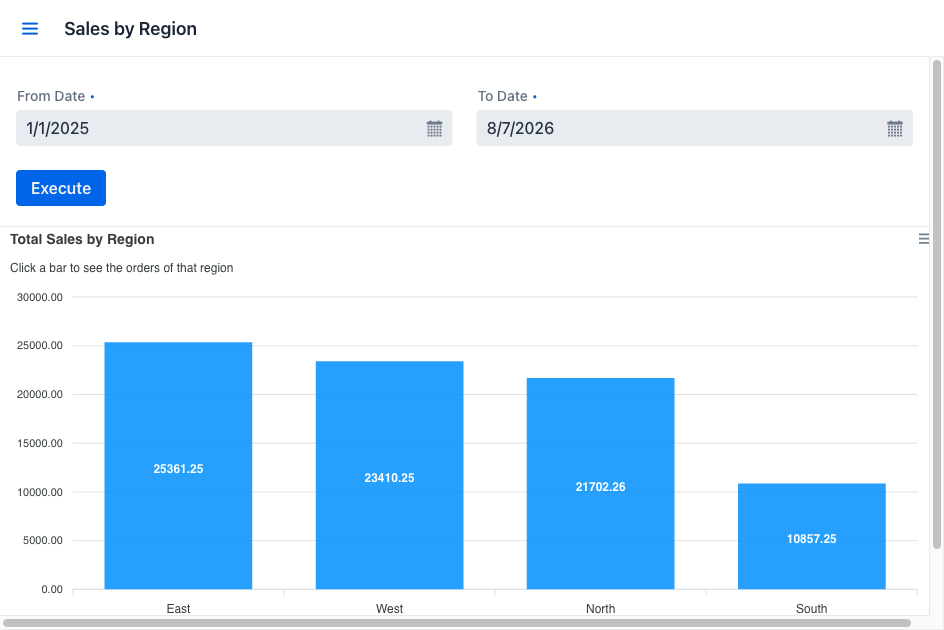
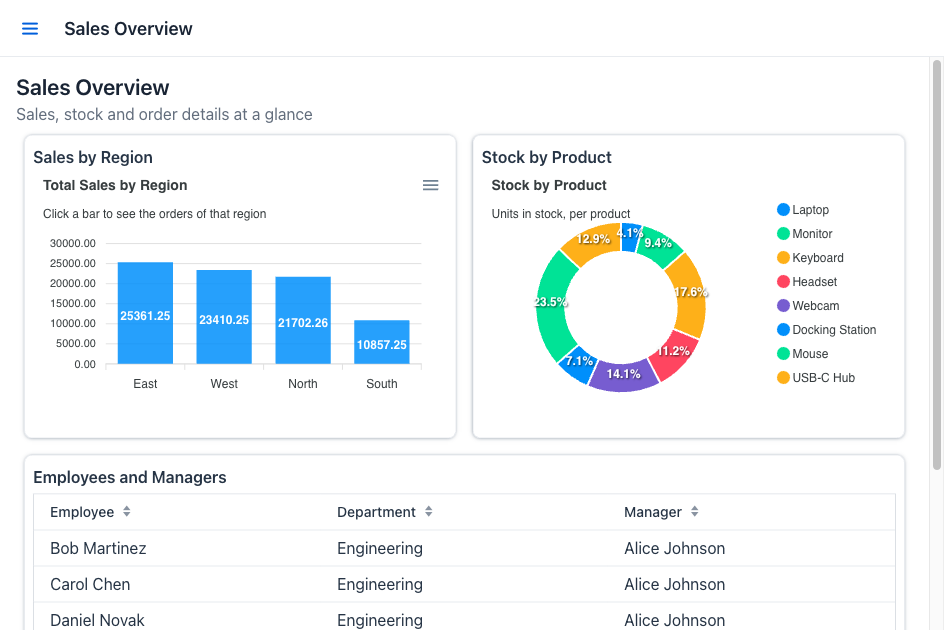
Map result columns to chart roles and render bar, line, area, pie, donut or scatter visualizations alongside the data grid — configured on the query definition, not in code.
Drill-Down Navigation
Make result cells and chart elements clickable: the value under the cursor is passed as a parameter to a target query, so users can move from a summary straight to the rows behind it.
Composable Dashboards
Place several queries on a single page that loads its data immediately, giving each role the operational overview it needs without building a bespoke view.
Visual Report Designer
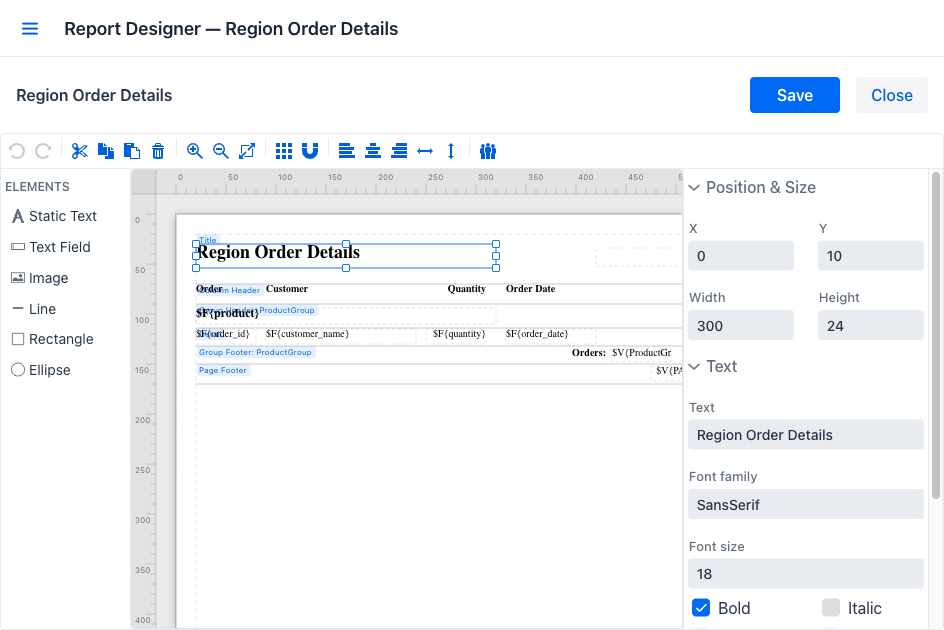
Design printed output in a band-based template editor — title, column headers, detail, group and page footers — and generate PDF documents straight from any query definition.
Multilingual Content
Query names, categories and dashboard titles are translatable, so the same reporting catalog reads correctly for every locale your application serves.
Your users need one more report. With Data Query that is a configuration change, not a release.
Technical profile
Technical compatibility
Last verified: August 29, 2026
View PricingCurrent requirements and integration details, verified against the product documentation.
| Requirement | Supported value | Integration notes | Documentation |
|---|---|---|---|
| Java | 21 | Runtime baseline for the current AppJars release. | Technical requirements |
| Vaadin | 25.2 | UI framework baseline for the current AppJars release. | Technical requirements |
| Spring Boot | 4.1 | Application framework baseline for the current AppJars release. | Technical requirements |
| Query connectors | SQL, HQL and REST | SQL uses the host DataSource, HQL uses its EntityManager and REST maps JSON responses to rows. | Three data sources |
| Visualizations | Bar, horizontal bar, line, area, pie, donut and scatter | Map query result columns to chart roles without writing visualization code. | Charts and dashboards |
| Report output | Spreadsheet export and visually designed PDF reports | Export result grids directly or generate PDF output from visual report templates. | Printed reports |
| Optional integration | I18N Manager | Adds runtime-managed translations for query, category and dashboard content. | Multi-AppJar integration |
Explore further:


Pricing
Per application, billed annually. Every plan includes the commercial license and a perpetual right to the last release covered by your subscription.
Core
Data Query turns stored query definitions in SQL, HQL or REST into complete reporting screens: generated parameter forms, lazy-loaded grids with sorting, filtering and export, and no redeploy to publish a report. Core includes the Commercial License for one Permitted Application and every update released during your one-year subscription, with perpetual rights to the last covered release.
- Unlimited Users & Developers
- Unlimited Environments & Deployments
- Offline license checking
Startup
Data Query turns stored query definitions in SQL, HQL or REST into complete reporting screens, with generated parameter forms, filterable grids, charts and dashboards. Startup adds the Customer Portal and its AI documentation assistant, plus ten Support Hours per year for help with query design, parameter defaults, and drill-down navigation.
Everything from Core, plus:
- Access to support portal
- AI Documentation Assistant
- 10 support hours included
Enterprise
Data Query turns stored query definitions in SQL, HQL or REST into complete reporting screens, with generated parameter forms, filterable grids, charts and dashboards. Enterprise includes everything in Startup, eighty Support Hours per year, and issue escalation directly to engineering. Right when business reporting depends on it.
Everything from Startup, plus:
- 80 support hours instead of 10
- Issue escalation for bug reports